 Diana Foster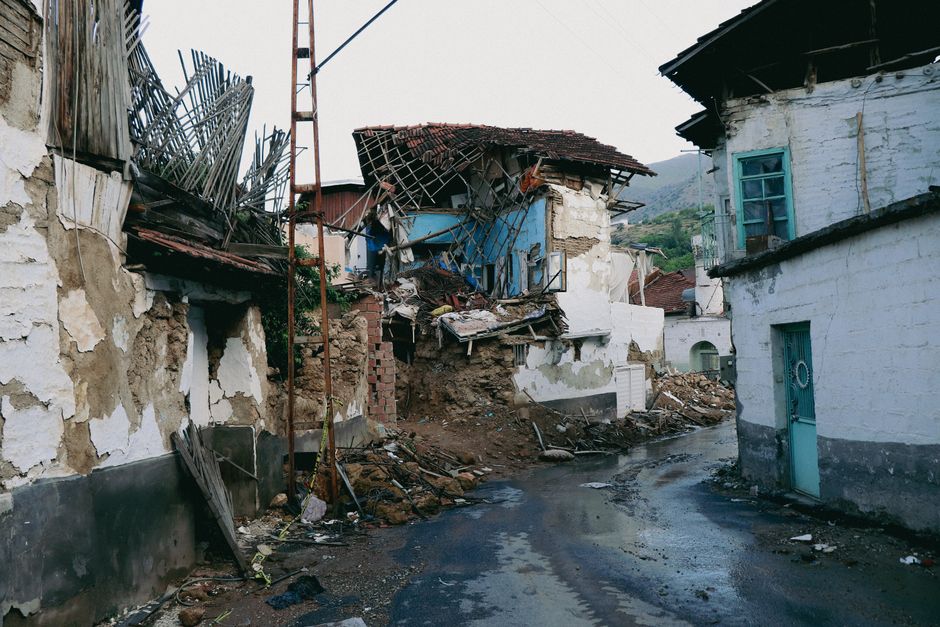
About two-thirds of American homes are underinsured. That’s not a scare tactic. That’s what the Insurance Information Institute has been tracking for years, and in my 14 years reviewing claims, I watched it play out on people’s kitchen tables every single time a major loss came in. The homeowner would sit across from me thinking they had plenty of coverage. Then we’d price out actually rebuilding their house. The gap was almost always thousands of dollars, sometimes tens of thousands, and the reason almost always traced back to one misunderstood term on page four of their policy.
Replacement cost value. Three words that should be simple. They’re not, because the insurance industry has spent decades letting people confuse them with something very different, and that confusion costs ordinary homeowners real money at the worst possible moment.
Here’s what I want you to actually understand by the time you finish reading this: replacement cost value (RCV) is not what your house is worth on Zillow, and it’s not what you paid for it. It’s what it would cost to rebuild it from the ground up, today, using current labor and materials prices. That number can be startlingly higher than any figure you’ve seen elsewhere, and whether your policy uses it matters enormously.
- Replacement cost value (RCV) pays to rebuild your home at today's labor and material prices, not depreciated value.
- About 2 in 3 American homes are underinsured, often because owners confuse market value with rebuilding cost.
- ACV (actual cash value) policies subtract depreciation before paying out, a 15-year-old roof may get you almost nothing.
- Construction costs have climbed sharply; policies not updated in 3+ years are almost certainly underinsured as of 2026.
- Extended or guaranteed replacement cost riders offer meaningful protection if you can afford the premium bump.
RCV vs. ACV: The Difference That Decides Your Claim
Let me show you the split plainly, because most agents gloss over it at the sale.
Actual Cash Value (ACV) pays you what the destroyed item was worth at the moment it was destroyed, after depreciation. Your 18-year-old roof had a useful life of maybe 25 years. Insurers will typically calculate it as having lost 72% of its value. If a new roof costs $22,000, an ACV policy might write you a check for around $6,160. The other $15,840 comes out of your pocket. (These percentages vary by insurer and state, but that math is close to what I saw routinely.)
Replacement Cost Value (RCV) pays to replace the roof at today’s cost, no depreciation deduction. Same $22,000 loss, you get $22,000, minus your deductible.
The catch people miss: even RCV policies usually pay ACV first, then release the “holdback” after you complete repairs and submit receipts. I can’t tell you how many homeowners called me furious about this, thinking we’d shorted them. The holdback mechanism exists to prevent payouts on repairs that never happen. You have to actually do the work to get the full amount. If you’re planning to sell the house instead of repair it, you may only collect ACV anyway.
| Feature | Actual Cash Value (ACV) | Replacement Cost Value (RCV) | Extended/Guaranteed RCV |
|---|---|---|---|
| Depreciation applied? | Yes | No | No |
| Typical premium vs. ACV | Baseline | 10-15% higher | 15-25%+ higher |
| Payout on 20-yr-old roof ($22k new) | ~$5,500-7,000 | $22,000 | $22,000+ overages covered |
| Rebuilding cost overruns covered? | No | Usually no (up to coverage limit) | Yes (extended: 20-50% over; guaranteed: full cost) |
| Best for | Tight budgets, older homes near end of life | Most homeowners | Homes in high-inflation/supply-crunch markets |
The premium difference is real but often overstated in the selling. I’ve seen homeowners decline RCV to save $180 a year, then face a $40,000 shortfall after a fire. That math doesn’t hold up.
How Replacement Cost Is Actually Calculated
Helpful resource: Arlo Pro 4 Wireless Security Camera System is a top-rated option for this. (As an Amazon Associate this site earns from qualifying purchases.)
Here’s where I’ll admit I got this wrong early in my career. I assumed the insurer’s estimate was basically the home’s tax-assessed value plus some multiplier. It isn’t.
Proper dwelling replacement cost calculation starts with square footage and multiplies by local construction cost per square foot, then adjusts for things like: roof type and pitch, foundation type, quality of finishes, custom features, number of bathrooms, garage type, and local labor markets. In rural Montana versus suburban New Jersey, the same 1,800-square-foot house might have wildly different rebuild costs.
Insurers use tools like CoreLogic’s 360Value platform or Marshall & Swift data (both industry standards) to estimate this. The problem is those estimates are only as good as the information provided, and if your agent entered your home’s square footage wrong or marked it as “average” finishes when you have hardwood floors and custom tile, the estimate is off. I’ve seen that specific error result in undercoverage of $60,000-plus.
Worked example:
Sarah, a homeowner in suburban Columbus, bought her house in 2019 for $285,000. Her policy was set at $285,000 in dwelling coverage. A kitchen fire in 2025 caused significant structural damage. Repair estimate: $198,000. Her coverage was technically sufficient here, but if a total loss had occurred, the actual rebuild cost by 2026 was estimated at $347,000 due to material cost inflation since 2019. She was underinsured by $62,000 without even knowing it.
Construction material costs are not subtle. The National Association of Home Builders reported that softwood lumber prices alone saw multi-year volatility that added roughly $14,000-18,000 to the cost of a typical new single-family home. Labor shortages in skilled trades have compounded this in most markets. As of July 2026, rebuild costs in many metro areas are 25-40% higher than they were in 2019. If your coverage limits haven’t been reviewed since before the pandemic, the gap is probably larger than you want to think about.
These are averages. Custom finishes, accessibility features, or unusual structural elements can push any of these numbers meaningfully higher.
The Extended and Guaranteed RCV Options (and When They’re Worth It)
Standard RCV policies pay up to your coverage limit, period. If your house cost $380,000 to rebuild but your limit is $300,000, you eat the $80,000 difference. This is why the industry offers two upgrades:
Extended replacement cost adds a buffer, typically 20%, 25%, or 50% above your stated limit. So a $300,000 policy with 25% extended coverage would pay up to $375,000.
Guaranteed replacement cost pays whatever it actually costs to rebuild, with no cap. These policies are harder to find, more expensive, and some insurers have pulled them from high-risk markets entirely. But if you can get one and afford it, especially on an older home or in a wildfire or hurricane zone, it’s meaningful protection.
Worked example:
Tom and Ellen in suburban Portland, Oregon, had a $420,000 dwelling limit with a 25% extended RCV endorsement, effective cap of $525,000. A wildfire in their area resulted in a total loss. Rebuilding during a regional construction surge cost $498,000. Extended coverage covered the gap. Without that endorsement, they’d have been short $78,000. The endorsement had cost them an additional $310/year in premium. Fifteen years of payments would have been $4,650. They came out $73,350 ahead.
The math usually favors extended coverage if you’re in a market with supply-constrained rebuilding capacity. The National Association of Insurance Commissioners (NAIC) has published consumer guidance specifically recommending that homeowners revisit dwelling coverage limits annually because of this exact problem.
What Most People Don’t Know to Ask
A few things I never saw adequately disclosed at the point of sale:
Inflation guard endorsements automatically increase your coverage limit each year by a percentage (often 4-8%) to track construction cost inflation. Many policies offer this. Very few agents proactively explain it. Ask if yours has one, and if not, whether you can add it. Without it, you’re responsible for manually updating your limit every year, and almost no one does.
Separate coverage for personal property. Your dwelling RCV covers the structure. Your personal property coverage is often set at 50-70% of dwelling value by default, but it may use ACV for your belongings unless you specifically add an RCV endorsement for contents too. A 10-year-old couch on ACV is worth almost nothing. Confirm which method applies to your stuff.
The home inventory you never made. If you suffer a total loss and need to claim personal property, you’ll need to itemize everything. From memory. Under stress. I’ve watched people lose thousands simply because they couldn’t document what they owned. A home inventory app like Encircle or even just a slow walk-through video stored in the cloud takes two hours and could recover real money. (The site may earn a commission on linked products.)
Worked example:
A couple in Phoenix suffered a kitchen fire that spread to two rooms. Total personal property loss was later estimated at $68,000. Because they had RCV for contents, the claim paid $66,400 after deductible. Their neighbor with a nearly identical loss and ACV contents coverage received $31,200 for the same type of items. Same fire. $35,000 difference. Different endorsement.
Sources
- Insurance Information Institute (III): Consumer data on underinsurance rates and replacement cost policy explanations.
- National Association of Insurance Commissioners (NAIC): Consumer guidance on dwelling coverage and annual limit review recommendations.
- National Association of Home Builders (NAHB): Published data on material cost volatility and per-home cost increases through the current period.
- CoreLogic / Marshall & Swift: Industry-standard residential replacement cost modeling data, regional estimates current as of 2026.
- Federal Reserve Bank regional surveys: Labor cost and construction market tightness data used to contextualize regional rebuild cost variation.
Photo: Serkan Gönültaş via Pexels
This article is for general informational purposes only and does not constitute insurance advice. Coverage details, exclusions, and costs vary significantly by insurer, policy type, and location. Always review your policy documents and consult a licensed insurance professional for advice specific to your situation.
Recommended Resources
Disclosure: As an Amazon Associate, we earn a small commission from qualifying purchases at no extra cost to you. We only recommend products that genuinely support the topics covered in this article.
- Kidde 10-Year Battery Smoke & CO Detector (~$32), Dual smoke and carbon monoxide detector with 10-year sealed battery, no battery replacement needed for a decade.
- Ring Alarm 8-Piece Security Kit (~$199), Professional-grade DIY home security system with optional 24/7 monitoring, top way to qualify for insurance discounts.